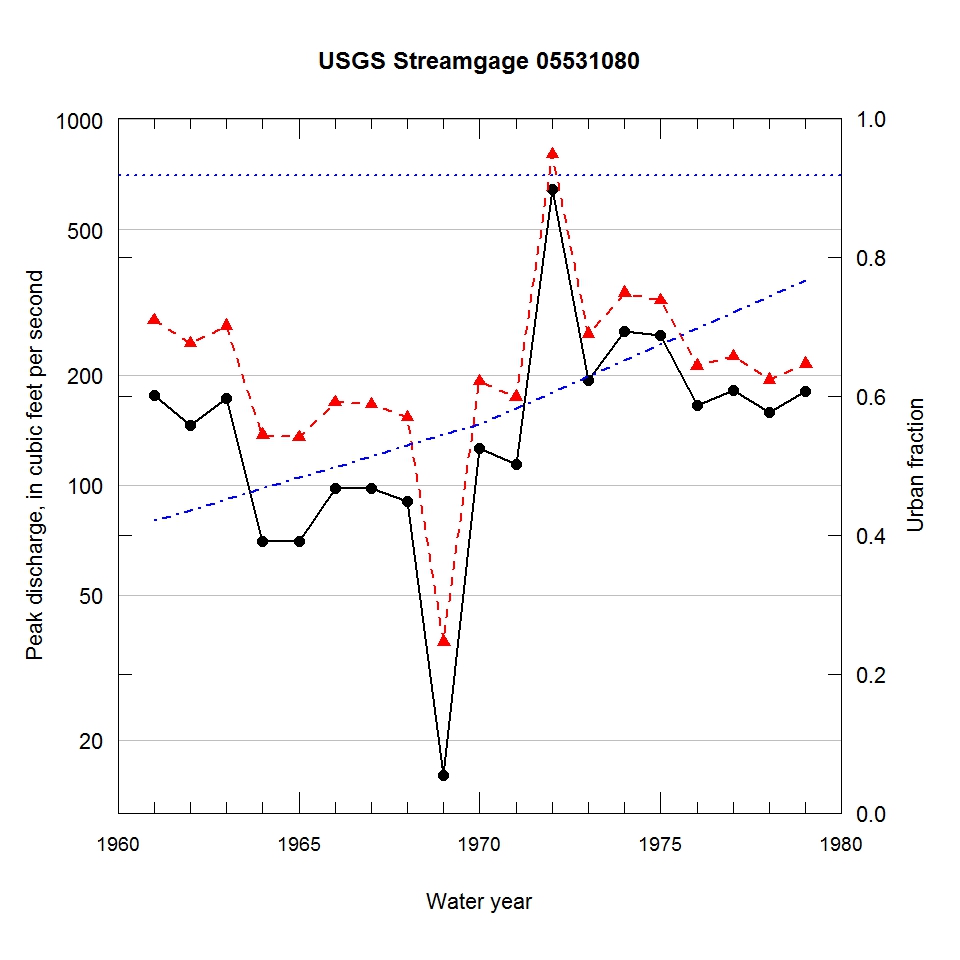
Observed and urbanization-adjusted annual maximum peak discharge and associated urban fraction and precipitation values at USGS streamgage:
05531080 SPRING BROOK AT BLOOMINGDALE, IL


| Water year | Segment | Discharge code | Cumulative reservoir storage (acre-feet) | Urban fraction | Precipitation (inches) | Observed peak discharge (ft3/s) | Adjusted peak discharge (ft3/s) | Exceedance probability |
| 1961 | 1 | -- | 0 | 0.420 | 1.438 | 176 | 282 | 0.228 |
| 1962 | 1 | -- | 0 | 0.436 | 0.254 | 146 | 244 | 0.379 |
| 1963 | 1 | -- | 0 | 0.451 | 1.159 | 173 | 272 | 0.259 |
| 1964 | 1 | 4B | 0 | 0.467 | 0.254 | 70 | 137 | 0.874 |
| 1965 | 1 | 4B | 0 | 0.482 | 0.254 | 70 | 135 | 0.881 |
| 1966 | 1 | -- | 0 | 0.498 | 1.332 | 98 | 168 | 0.740 |
| 1967 | 1 | -- | 0 | 0.513 | 1.408 | 98 | 166 | 0.752 |
| 1968 | 1 | -- | 0 | 0.529 | 1.307 | 90 | 153 | 0.806 |
| 1969 | 1 | -- | 0 | 0.544 | 1.305 | 16 | 37 | 1.000 |
| 1970 | 1 | -- | 0 | 0.560 | 1.318 | 126 | 192 | 0.616 |
| 1971 | 1 | -- | 0 | 0.582 | 0.365 | 114 | 174 | 0.713 |
| 1972 | 1 | -- | 0 | 0.605 | 1.199 | 645 | 803 | 0.007 |
| 1973 | 1 | -- | 0 | 0.628 | 0.445 | 193 | 259 | 0.308 |
| 1974 | 1 | -- | 0 | 0.651 | 0.535 | 263 | 335 | 0.137 |
| 1975 | 1 | -- | 0 | 0.674 | 0.980 | 256 | 320 | 0.159 |
| 1976 | 1 | -- | 0 | 0.697 | 0.988 | 165 | 212 | 0.521 |
| 1977 | 1 | -- | 0 | 0.720 | 0.738 | 181 | 225 | 0.461 |
| 1978 | 1 | -- | 0 | 0.743 | 1.237 | 158 | 194 | 0.605 |
| 1979 | 1 | -- | 0 | 0.766 | 1.245 | 180 | 214 | 0.513 |

